Using Data Analytics to Identify Your App’s Most Valuable Features
February 5, 2025 - 41 minutes readAfter reading this article, you’ll:
- Understand the vital role of data-driven decision-making in mobile app development, including how to collect and analyze key metrics like user engagement, retention rates, and feature usage to guide development priorities rather than relying on assumptions or opinions.
- Learn how to effectively validate feature importance through a combination of A/B testing and user feedback, creating a feedback loop that ensures features truly resonate with users before full deployment and helps identify opportunities for improvement.
- Master the best practices for continuous feature optimization, including how to embed metrics in the development cycle, iterate based on data insights, and foster a data-driven culture that consistently improves app performance and user satisfaction over time.

Mobile app development is no longer driven by guesswork or gut instinct – it’s guided by data. In an ultra-competitive app market (millions of apps for 6.84 billion smartphones), success hinges on delivering a superior user experience. How do you decide which app features deserve your focus? The answer lies in data-driven decision-making. By leveraging analytics to understand what users value, companies can prioritize the features that truly make an impact and avoid wasting resources on those that don’t.
This article explores the importance of data-driven decisions in app development and explains how to use analytics to pinpoint your app’s most valuable features.
The Importance of Data-Driven Decision-Making in App Development
Data-driven decision-making means using real user data to guide development choices, rather than hunches. Embracing this approach in mobile app development yields several benefits. First, it reduces bias and removes the danger of decisions based solely on opinions or the loudest voice in the room. Instead of going by gut feeling, developers rely on objective evidence of what users actually do and want. This often leads to a better user experience and higher engagement, because features are shaped around proven user preferences.
In fact, using analytics can highlight which features truly engage users, helping teams tailor the app to their audience’s needs. Data-driven decisions also tend to improve ROI – resources are invested in features that have the greatest impact on the business, whether that’s boosting retention or revenue.
The cost of ignoring data can be high. Most projects underperform if they rely on assumptions rather than facts. By contrast, successful app companies treat analytics as a “compass” for their roadmap, using data to guide them toward better user experiences and performance.
Making informed decisions through data isn’t just helpful – it’s essential for competing effectively. In summary, data-driven decision-making in app development helps teams build the right features, for the right users, in the right way, leading to more engaging and successful apps.
Key Data Points and Metrics to Assess Feature Value
Not all app features contribute equally to success, so how do you determine which features are most valuable? The key is to track specific metrics that reveal user behavior and satisfaction. Here are some of the most important data points and metrics mobile teams should monitor:
User Engagement
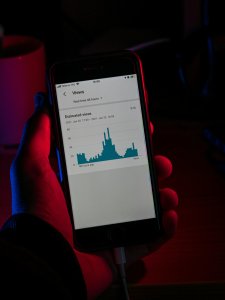
Measure how actively users interact with your app. This includes metrics like daily or monthly active users (DAU/MAU) and session duration (how long users spend in the app per visit). High engagement suggests certain features are compelling. For example, if users consistently spend several minutes on a particular feature or return to it frequently, that feature is delivering value.
Retention Rate
This is the percentage of users who return to the app over a given period (e.g. Day 7 or Day 30 retention). A strong retention rate means users find ongoing value in your app and its features. Tracking retention helps identify which features encourage users to keep coming back. Often, features that drive up retention are considered core to your app’s value proposition.
Churn Rate
Churn is essentially the opposite of retention – it measures the rate at which users stop using the app. If you notice many users dropping off after a certain update or ignoring the app over time, churn analysis can pinpoint problematic features or onboarding issues. Reducing churn is critical, since retaining users is far more cost-effective than constantly acquiring new ones.
Conversion Rates
Define what “conversion” means for your app (it could be a free user upgrading to a paid plan, a user completing a purchase, or signing up for an account) and track the percentage of users achieving that goal. Conversion metrics show whether features successfully lead users to take desired actions. For example, if you introduced a new feature with the goal of driving in-app purchases, its conversion rate will tell you how effective it is.
Feature Usage & Adoption
Drill down into how often specific features are used and by how many users. A feature adoption rate (the proportion of users who use a feature at least once) indicates discoverability and interest. Frequent usage suggests a feature is valuable to users’ workflows, whereas features with low adoption might be candidates for improvement or removal. Usage patterns can highlight hidden “gems” in your app that deserve more attention, or features that aren’t living up to expectations.
Session Duration & Frequency
Look at session length and frequency of use in relation to certain features. If introducing a feature increases the average session duration, it likely means users are finding it engaging or useful. Similarly, if users start opening the app more frequently after a feature launch, that feature may be enhancing the app’s overall value. These engagement nuances complement raw active user counts to show depth of engagement.
Customer Lifetime Value (CLV)
CLV is the total value (often measured in revenue) a user brings over their entire time using the app. By linking features to revenue generation or long-term user value, you can identify which features contribute the most to the bottom line. For instance, if users who engage with a particular feature tend to stay subscribed longer or spend more, that feature is clearly valuable from a business standpoint.
 Each of these metrics provides a different perspective on feature value. Engagement and usage metrics reveal what parts of your app capture attention. Retention and churn tell you which features keep users around (or drive them away). Conversion and revenue-related metrics show which features fulfill business goals.
By combining these data points, you get a holistic view of which features are truly driving success. Importantly, define a handful of key performance indicators (KPIs) that matter most for your app’s mission (e.g. if your app is a game, you might focus on daily engagement and in-app purchase conversions; for a productivity app, perhaps 30-day retention and subscription rate). Clear metrics will guide your analysis in the next steps.
Collecting and Analyzing User Behavior Data Effectively
To harness these metrics, you need reliable user behavior data. Collecting and analyzing data effectively involves a few best practices:
1. Instrument Your App to Track Key Events
Begin by deciding which user actions and events to track in the app. These should align with the metrics above – for example, logging when a user uses Feature X, completes a purchase, or drops off at a certain step. Most mobile apps integrate analytics SDKs or custom tracking code to capture events (screen views, button taps, transactions, etc.) behind the scenes.
The goal is to gather quantitative data on how each feature is used. If you haven’t already, set up analytics tools (there are many options) to record downloads, active users, session times, feature clicks, and more. Having this instrumentation in place ensures you can measure what’s happening inside your app.
2. Set Clear Goals and KPIs
Before drowning in data, clarify what success looks like for your app and features. Establish specific goals (e.g. “increase 7-day retention to 40%” or “achieve 500 conversions per week from Feature Y”). This will focus your data collection on the metrics that matter. As one guide advises, start by setting clear goals for your app so you know which data is most relevant to collect. Having defined KPIs helps you filter signal from noise when analyzing later.
3. Collect Both Quantitative and Qualitative Data
Numbers alone don’t tell the whole story. While analytics platforms provide quantitative data (clicks, time spent, counts of users), try to supplement this with qualitative insights (user opinions and reasons behind behaviors). Methods include in-app surveys, user interviews, feedback forms, or app store reviews.
Quantitative data shows what users are doing; qualitative feedback helps explain why. For example, analytics might show users abandoning a feature quickly, while survey responses reveal they found it confusing. By gathering both types, you get a comprehensive understanding of user behavior.
4. Analyze for Patterns and Trends
Once data is collected, it’s time to turn raw data into insights. Use analytic dashboards or export data for analysis to identify trends. Look for patterns like drop-off points (where in a workflow users quit the app, indicating a problematic step) or spikes in usage (after a feature launch or marketing campaign).
Perform cohort analysis to see how user retention or behavior changes for users who joined at different times or who used certain features. For instance, you might discover that users who engage with Feature Z within their first week have a 2x higher retention rate – a strong signal of that feature’s value. Also, compare different user segments: Do power users (high-frequency users) gravitate to certain features more than casual users?
Such analysis can highlight which features drive engagement among your most loyal users. The objective is to translate the numbers into actionable stories: e.g., “Feature A has a steep learning curve causing new users to drop off, whereas Feature B is used by 80% of daily active users, making it a candidate for further investment.”
5. Use the Right Tools and Methods
Effective analysis might involve funnel analysis (to see conversion rates through multi-step processes), heatmaps or session recordings (to observe user interactions in detail), and statistical analysis for experiment results. Modern mobile analytics solutions often come with these capabilities, but even simple spreadsheets can work for basic metrics tracking.
 The key is to systematically go through the data with your questions or hypotheses in mind. For example, if you suspect a feature isn’t pulling its weight, check its usage frequency and any correlation with retention or revenue. Always be sure to validate insights across data sources – if analytics show a trend, see if user feedback or other metrics corroborate it. This reduces the chance of misinterpreting data.
Finally, ensure that data is collected ethically and accurately. Respect user privacy by anonymizing analytics data and following applicable data protection laws. Make sure your event tracking is tested and correct – bad data can be misleading. When done right, efficient data collection and analysis gives you a trustworthy foundation to identify which features users love, which ones they ignore, and where to focus your development efforts next.
Interpreting Data to Prioritize Features
With a wealth of user data in hand, the next challenge is making sense of it to guide feature prioritization. Simply having metrics isn’t enough – you need to interpret them in context and derive insights that inform your product roadmap. Here are strategies to translate analytics into smart feature decisions:
Identify Your Star Features and Weak Links
Look at the usage and engagement metrics to spot which features are performing best and worst. High user engagement and frequent use are strong indicators of a “star” feature – these are features delivering clear value. If 80% of your users engage with Feature A every session, that feature is likely a core value driver.
On the flip side, features that consistently show low usage or are often associated with drop-offs may be weak links.
For example, if Feature C is used by only 5% of users and has a low conversion rate, its value is questionable. This doesn’t automatically mean you should cut the feature – but it signals that it either needs improvement or is not a priority compared to others. By ranking features based on engagement, retention, or conversion metrics, you create a data-informed feature hierarchy from most valuable to least.
Connect Features to Retention and Revenue
Dig deeper by analyzing how each feature impacts key outcomes like retention and revenue. Sometimes a feature might not be the most used, but it has outsized impact on business goals. For instance, maybe only 20% of users use Feature B, but those who do have 3x the lifetime value (they stick around longer or spend more).
That makes Feature B very valuable, warranting attention even if it’s not universally used. Consider running correlation analyses: do users who use Feature X in their first week show higher 30-day retention? Does introduction of Feature Y correlate with increased average revenue per user? Such connections help you quantify feature value in terms of outcomes.
Metrics like churn rate or customer lifetime value can act as a lens to filter for features that directly impact revenue or long-term loyalty. Features tied to low churn or high LTV should rise to the top of your priority list because they contribute directly to your app’s sustainability.
Use Data to Drive an Objective Prioritization Framework
It’s often helpful to apply a formal prioritization framework that incorporates your data. One popular example is the RICE scoring model – which stands for Reach, Impact, Confidence, and Effort. For each proposed feature or improvement, you estimate: how many users it will reach, how big its impact could be on a key metric, how confident you are in your data/estimates (based on evidence), and how much effort it takes to implement.
This framework produces a score that can rank features objectively. Data plays a role in each factor: your analytics tell you the potential reach (e.g. “40% of users visit the screen where this feature would live”), the impact (e.g. “expect conversion rate to increase 10% based on similar past experiments”), and boost your confidence if there’s strong user evidence.
Other models like a Value vs. Effort matrix or the Kano model similarly use data on user value and effort to categorize features. The exact framework matters less than the principle: ground your prioritization in evidence. This guards against the HiPPO effect (Highest Paid Person’s Opinion) dictating what gets built, and instead focuses on what the user data supports.
Balance User Needs with Strategic Goals
Data interpretation isn’t purely about following the numbers blindly – it’s about informed decision-making. You should weigh user behavior data alongside business strategy and user feedback. If analytics show a feature is underused, ask why: Is it poorly implemented, or do users truly not need it?
Maybe a marketing push or a redesign could unleash its value. Conversely, if a niche feature has a small but devoted usage, consider if it serves an important segment or if its resources could be better spent enhancing a more broadly used feature. Use your data as the voice of the user in product discussions. It provides an empirical basis to justify prioritizing one feature over another.
For example, data might reveal that improving Feature A could potentially reduce churn by 5%, whereas adding new Feature D might only be relevant to a tiny fraction of users. That insight directs you to invest in improving Feature A first. By interpreting data in the context of user needs and business objectives, you turn analytics into a strategic tool for feature prioritization.
Interpreting data to prioritize features means letting the evidence guide you. It shifts the conversation from “I think this feature is important” to “The data shows this feature is important.” This approach leads to smarter allocation of development effort – focusing on features that will delight users, move the needle on key metrics, and achieve business goals. It also creates transparency: stakeholders can see the rationale behind decisions in the form of hard numbers and analysis, which builds confidence in the product direction.
Validating Feature Importance with A/B Testing and User Feedback
Identifying a promising feature through analytics is one step – validating that insight is the next. Two powerful techniques to confirm a feature’s value are A/B testing and collecting user feedback. These methods ensure that your interpretations and plans truly resonate with users before you fully commit resources.
A/B Testing
A/B testing (also called split testing) is like a scientific experiment for your app. You create two versions of a feature or design – A (the control) and B (the variant) – and expose each version to a subset of users, then measure which performs better on target metrics. This process allows you to isolate the effect of a single change or feature. In mobile apps, A/B testing might involve enabling a new feature for 10% of users while 90% use the old version, and then comparing metrics like engagement, conversion, or retention between the groups.
For example, if you’re unsure whether a new onboarding tutorial improves 7-day retention, you can A/B test it: one group sees the new tutorial, one doesn’t, and you see which group retains more users. A/B testing provides statistically valid evidence of a feature’s impact, taking the guesswork out of feature evaluation. It’s especially useful for validating feature tweaks (like UI changes or new recommendations) and de-risking big changes. By rolling out new functionality to a small segment first, you reduce the risk of negatively impacting the whole user base.
If the test shows positive results – say variant B users have significantly higher conversion – you can confidently deploy that change to everyone, knowing it adds value. If not, you’ve learned cheaply and can iterate again. In short, A/B testing empowers data-driven decisions by proving which version of a feature best meets your goals, under real-world conditions and user behavior.
User Feedback
While numbers reveal what users do, feedback tells you why they do it (or how they feel about it). User feedback can come through app store reviews, customer support tickets, direct user surveys, usability tests, or feedback forums. This qualitative input is crucial for validating feature importance because it captures the voice of the user in ways analytics might miss.
For instance, your analytics might show Feature X is rarely used – feedback might reveal that users want to use it but find it too difficult to navigate, or they don’t realize it exists. Alternatively, you might see a feature with moderate usage, but feedback highlights that the users who do use it find it incredibly valuable – indicating an opportunity to surface it more or improve it.
Listening to users’ comments and requests helps validate whether a feature truly resonates. If many users are requesting a particular feature or enhancement, that’s a strong signal of potential value. Similarly, if a feature draws a lot of positive feedback (“I love that I can do X in this app!”), it confirms the feature’s importance to user satisfaction. On the other hand, negative feedback or complaints pinpoint areas where features are falling short.
Combining Data and Feedback
The real magic happens when you bring analytics and user feedback together. Analytics might show which features are popular, and feedback will often explain why those features are popular or how they could be even better. For example, your data flags that Feature Y has the highest daily active usage. User feedback then reveals that users love Feature Y because it saves them time, but they wish it had an extra option to be even more useful.
This insight validates Feature Y’s importance and directly informs a valuable enhancement – all rooted in user input. Conversely, suppose analytics show few people use Feature Z. Feedback might tell you those who do use Z find it confusing (so the low usage is due to design issues, not lack of interest).
That tells you the feature’s potential value isn’t fully realized, guiding you to fix the UX rather than discard the feature outright. Always cross-check: if data and feedback both point to a feature being high-value, you know you’ve hit on something worth investing in. If they diverge, investigate further – the truth may be in the details (e.g., a small but vocal user group loves a feature that most ignore).
A/B testing and feedback can work in tandem as well. You might A/B test a new feature and also gather feedback from the test users (through a prompt or survey) about their experience. This can validate the quantitative results with qualitative context. Moreover, when you do decide to roll out a feature based on data insights, continue to monitor feedback post-release.
Users will quickly let you know if the feature meets their expectations or if it has issues, giving you a chance to iterate. Remember that validation is an ongoing process – even a feature that tested well should be continuously evaluated through user data and feedback as your audience grows or changes.
A/B testing provides experimental proof of feature impact, and user feedback provides experiential insight into feature importance. Both are essential tools for confirming that the features you deem valuable are indeed hitting the mark. Together with analytics, they form a feedback loop: data -> hypothesis -> A/B test -> user feedback -> refine -> data…, ensuring your app evolves in the right direction. Mobile app analytics coupled with user feedback are key factors that help developers create effective, successful apps by understanding user behavior and needs in depth.
Best Practices for Continuous Feature Optimization
Identifying your app’s most valuable features is not a one-time task – it’s an ongoing practice. The mobile app landscape and user preferences can change rapidly, so developers and product teams should commit to continuously optimizing features using data insights. Here are some best practices to foster a cycle of continuous improvement:
Embed Metrics in Your Development Cycle
Make tracking and reviewing key metrics a routine part of development. Before building or updating any feature, define the KPIs it’s meant to influence. After release, monitor those metrics closely (daily or weekly dashboards can help) to see if the feature is performing as expected.
By baking metrics into the process, teams stay focused on outcomes, not just output. For example, if Feature A is intended to improve engagement, watch the session length and frequency data after its launch. This real-time performance check will inform if further tweaks or rollbacks are needed.
Iterate and Improve Regularly
Adopt an iterative mindset – launch enhancements, measure results, learn, and iterate again. Data-driven app development is inherently an iterative process: you test new features or designs, use the data to refine them, and keep polishing. Don’t wait for a once-a-year major update; instead, release small improvements continuously.
Each iteration should be guided by what the data and user feedback from the last version told you. This agile approach ensures your app’s features are always evolving toward greater effectiveness.
Prioritize High-Impact Updates
Use your analytics to focus optimization efforts where they matter most. It can be tempting to spend time on cosmetic changes or minor features, but data can highlight the areas that will yield the biggest returns. If your analysis shows that improving Feature B’s usability could reduce churn by a significant percentage, prioritize that over tweaking a low-usage feature.
Continuously ask, “What does the data indicate is our biggest opportunity or most pressing issue right now?” and let that guide your roadmap. This way, your team’s energy is spent on changes that move core metrics in the right direction.
Conduct Regular A/B Tests and Experiments
Even after initial feature rollout, continue running A/B tests for optimizations. For instance, you might test two different layouts for a highly used screen to see which one further boosts conversions. By treating the app as a constant experiment, you uncover improvements that might not be obvious upfront.
Make sure to run tests long enough to gather meaningful data and be willing to iterate based on the results. Continuous experimentation prevents stagnation and drives a culture of evidence-based enhancement.
Keep Listening to Users
Maintain open channels for user feedback at all times. As your app grows, your user base might change in needs or expectations. Regularly collect feedback through in-app prompts (“How do you like this new feature?”), community forums, or support interactions. Pay attention to app store reviews as well – they often highlight pain points or beloved features.
By continuously listening, you can catch emerging issues early and also identify new feature ideas that data alone might not reveal. Showing users that you update the app frequently and respond to their input can increase loyalty and engagement.
Foster a Data-Driven Culture
Encourage everyone on the team – developers, designers, product managers, marketers – to use data in their decision-making. When the whole team is aware of key metrics and regularly sees analytics reports, it creates accountability and shared purpose. Consider having routine meetings to go over analytics and user feedback, brainstorming solutions as a team.
Organizations that instill a data-driven mindset empower their teams to pull actionable insights from data and continually improve the product. In such a culture, optimizing features becomes second nature rather than an afterthought.
Be Adaptable and Stay Informed
Finally, remain adaptable. The “most valuable features” of your app today might change tomorrow due to market trends, new competitors, or changes in user behavior. Keep an eye on broader app industry trends and be ready to adjust your metrics and goals.
If a new platform capability or user expectation arises (for example, voice control or dark mode), use data and experiments to decide if and when to integrate those into your features. Continuous optimization means never resting on your laurels; always be willing to learn and adapt.
By following these best practices, companies can ensure their mobile apps are continually aligned with user needs and preferences. Data analytics is not a one-off project but a long-term companion in your app’s journey. It enables an ongoing feedback loop of measure, learn, and improve. Teams that embrace this cycle often find they can deliver updates faster, respond to user needs more precisely, and steadily increase the app’s performance and user satisfaction over time.
Leveraging data analytics to identify and optimize your app’s most valuable features is a game-changer for mobile app success. It empowers you to make informed, impactful decisions at every stage of development. By focusing on meaningful metrics, listening to your users, testing your ideas, and iterating relentlessly, you create an app that not only attracts users but keeps them delighted.
In the dynamic world of mobile apps, a data-driven approach is your competitive advantage – helping you prioritize what matters most and delivering an experience that stands out in the crowd. Armed with data and a mindset of continuous improvement, any company can elevate their app’s features from simply functional to truly unforgettable.
Frequently Asked Questions (FAQs) on Using Data Analytics to Identify Your App’s Most Valuable Features
What metrics should I focus on to determine if an app feature is valuable?
The most important metrics to track include user engagement (daily/monthly active users and session duration), retention rates (percentage of returning users), churn rates (users who stop using the app), conversion rates (users completing desired actions), and feature adoption rates (how many users actually use specific features). Additionally, tracking Customer Lifetime Value (CLV) can help identify which features contribute most to revenue generation. Focus on metrics that align with your app’s specific goals and mission.
How do I effectively collect user behavior data for my app?
Start by instrumenting your app to track key events using analytics SDKs or custom tracking code. Set clear goals and KPIs before beginning data collection. Gather both quantitative data (through analytics platforms) and qualitative feedback (through surveys, interviews, and app store reviews). Ensure you’re collecting data ethically and accurately, respecting user privacy and following data protection laws. Use appropriate analytics tools to track downloads, active users, session times, and feature usage.
What is A/B testing, and why is it important for feature validation?
A/B testing is a method where you create two versions of a feature or design (A and B) and expose each version to different user groups to measure which performs better. It’s important because it provides statistically valid evidence of a feature’s impact rather than relying on assumptions. For example, you might test a new onboarding tutorial with 10% of users while keeping the original version for 90%, then compare retention rates between the groups. This helps validate feature effectiveness before full deployment.
How can I balance user feedback with analytics data when making feature decisions?
Combine quantitative analytics data with qualitative user feedback to get a complete picture. While analytics show what users do, feedback explains why they do it. For instance, if analytics show low usage of a feature, user feedback might reveal it’s difficult to find or confusing to use rather than unwanted. Use analytics to identify patterns and trends, then validate and understand these patterns through user feedback. When both data and feedback align on a feature’s value, you can be more confident in your decision-making.
How often should I review and optimize app features based on data?
Feature optimization should be an ongoing, continuous process rather than a one-time task. Make tracking and reviewing key metrics a routine part of your development cycle with regular monitoring (daily or weekly) of feature performance. Adopt an iterative approach where you launch enhancements, measure results, learn from the data, and make improvements accordingly. Regular review cycles help you stay responsive to changing user needs and market conditions. However, ensure you’re giving features enough time to gather meaningful data before making major changes.
Tags: A/B testing, analytics, app analytics, app development


